INTERACTIVE TUTORIAL
Click the next button to explore the interactive options on the map.
CITY OF CAPE TOWN’S INFORMAL SETTLEMENTS
The black boundaries on the map are the borders of the informal settlements within the City of Cape Town. A informal settlement pocket is a cluster or grouping of tin shack housing which can vary in size from a few shacks to a few thousand. Pockets are grouped by the City of Cape Town to make up Informal Settlements.
Click next to follow the stories of two informal settlement residents. It will guide you on how you can use the tool to explore the data on the map.
FOLLOW THEIR STORIES
Asithandile and Zukiswa are two of the 3,000 residents of informal settlements who made submissions to the City of Cape Town’s 2016/2017 draft budget.
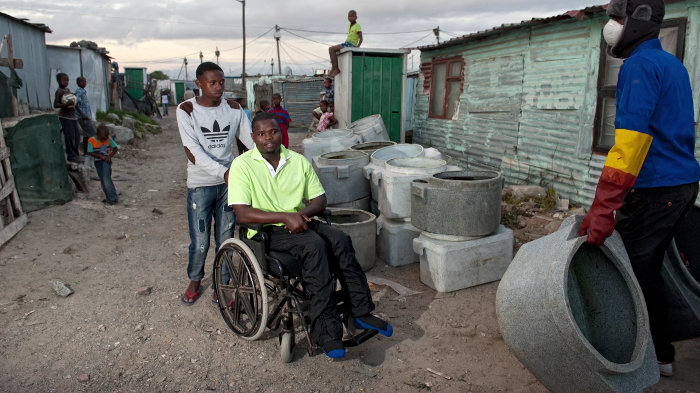
Asithandile lives in Kosovo Informal Settlement. He is wheelchair-bound after being shot by thugs in the Eastern Cape. This makes it difficult for him to navigate the poorly-maintained streets in Kosovo.
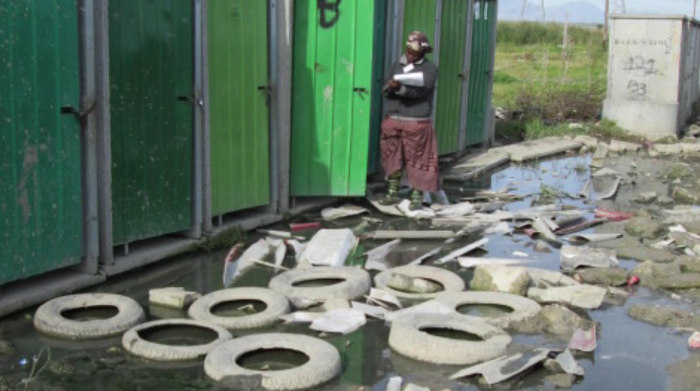
He needs help to get to the toilet and to get on and off his wheelchair once he’s there. So he must ask his brother to help, which he says makes him feel "useless and uncomfortable".
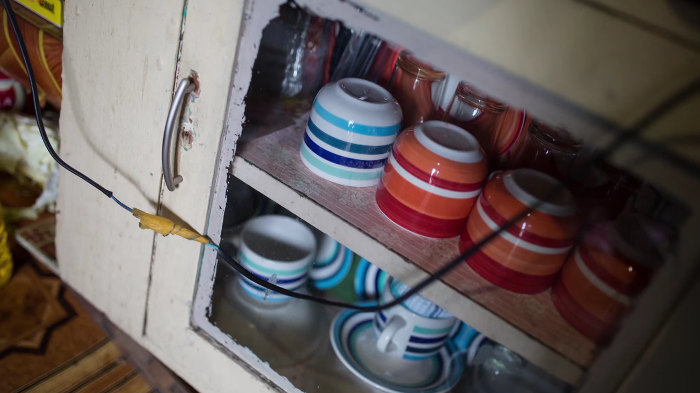
He feels vulnerable when he is alone at home, as there is no one to help him use the toilet and to assist him if he has a problem in his shack.
There are no toilets for the disabled in Kosovo and Asithandile’s plea to the City is to provide for them in the budget so that he - and others like him - can feel equal to able bodied people.
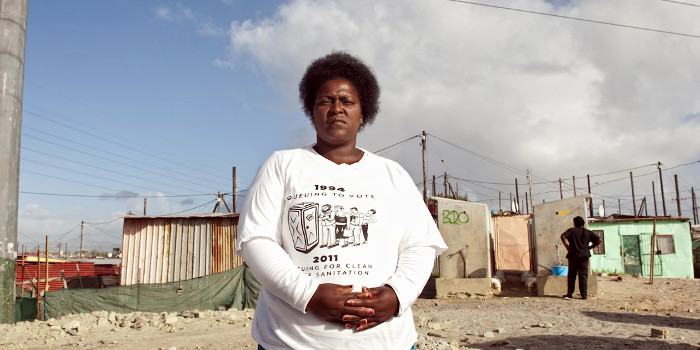
Zukiswa has been living in RR Section in Khayelitsha since 1999. When she first moved into the area there were no toilets at all. In 2015 the municipality built communal flush toilets, but she says it's not safe to use these flush toilets as they are far from her home. Also, these toilets are often blocked or broken.
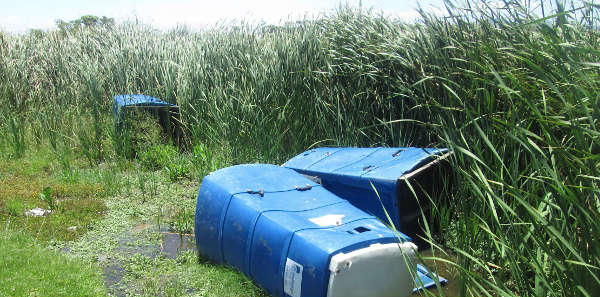
"There is nothing that I hate more, or that makes me more angry, than the Mshengu toilet.
They are unbearable and ... are prone to maggots and stink".
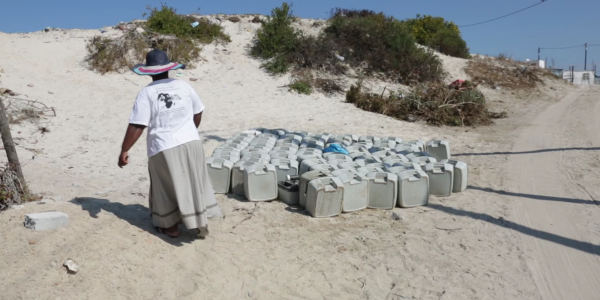
Portable chemical flush toilets - known as Porta Potties - are common in informal settlements. But they are unhygienic and women who use them are prone to vaginal infections.
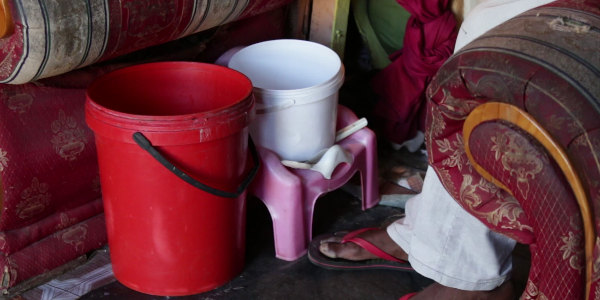
"As a person, whether young or old, who uses a bucket during the day or night, you can’t claim the City of Cape Town respects the dignity of black people."
Zukiswa has called on the City to take responsibility for implementing a plan with actionable time frames to provide permanent full flush toilets in informal settlements.
Challenges in RR Section:
- Using communal toilets puts residents at risk
- There are too few toilets and they are often far away from some residents’ homes;
- Zanele Xaki from RR Section in Khayelitsha was recently hit by a car while trying to cross a busy road to relieve herself in an open space next to the N2 highway
- Her husband was attacked by thugs while walking to an open space next to the N2, which many people use as a "toilet"
- Another resident, identified only as "Nosakhe" lived for six years with an overflowing drain in front of her house for home. Raw sewage from the drain often overflowed into her house. Her children had to be treated for diarrhoea by the Red Cross as a result of exposure to sewage, she says.
MAP LAYERS
The six boxes at the top of the map allow you to turn various data layers on the map on and off. You can also toggle between the boxes to explore further after completing this tutorial.
For now, click the “Temporary Toilets” button to switch from the “Boundary View” to see the toilets that are temporary, which are graded by colour. Of all the toilet types that the City of Cape Town has installed in informal Settlements only the full flush ones are considered to be permanent. The colour grading indicates the percentage of the toilet types that are permanent and/or full flush.
MAP LAYERS
The six boxes at the top of the map allow you to turn various data layers on the map on and off. You can also toggle between the boxes to explore further after completing this tutorial.
For now though just click the "Upgrade Category" button to switch from the "Boundary View", to see the category map on the City of Cape Town’s upgrade rating of the pockets. We can see that RR Section is categorised as having "Many constraints. May need to be relocated".
MAP LAYERS
We can see that Kosovo has a fairly high level of temporary sanitation. Between 60 to 80% of the toilets provided by the City are not permanent full flush toilets but instead fall into the category of temporary solutions - i.e. portable, container, chemical, or bucket types.
MAP LAYERS
Now click on the "Age" button to see the colour grading that indicates the age of an informal settlement. RR Section, for example, although categorised for relocation, is over 20 years old.
DATA DASHBOARD
Click on Kosovo Informal Settlement to see the data dashboard for this pocket.
DATA DASHBOARD
Click on RR Section to see the data dashboard for this pocket.
DATA DASHBOARD
This gives a breakdown of the basic information about Kosovo. There are 6,086 informal dwellings in the area, with a toilet to households ratio of 1:5 (one toilet per five dwellings). This doesn't sound too bad, but look at the the pie chart and you’ll see that only 37% of these are full flush.
The bar chart on the right lists the categories that the City uses to describe limitations to upgrading different informal settlements. In Kosovo, for example, we can see that 16% of the area is too close to a railway line. Click on the link at the bottom of the page to see the detailed descriptions of these constraints. It is interesting in light of this information to note that despite these constraints, 488 (permanent) full flush toilets have already been installed in the area.
DATA DASHBOARD
This gives a breakdown of the basic information about RR Section. There are 3,152 informal dwellings in the area, which is just under 18 hectares in size. This amounts to a density of 176 dwellings per hectare. We can also see that 57% of the toilets installed in RR Section are Porta-pottys.
The bar chart on the right lists the categories that the City uses to describe limitations to upgrading different informal settlements. In RR Section we can see the detail of the many constraints to upgrade that have been identified by the City of Cape Town, including the existence of waterbodies, private land ownership, proximity to metro roads, railways, servitudes and power lines.
Click on the link at the bottom of the page to see the detailed descriptions of these constraints. It is interesting in light of this information to note that despite these constraints, 307 (permanent) full flush toilets have already been installed in the area.
Scene Title
Scene 9 placeholder text
- Back
- Next
- Back
- Next
- Back
- Asithandile's story
- Zukiswa's story
- Back
- Next
- Next
- Back
- Back
- Next
- Next
- Back
- Back
- Next
- Next
- Back
- Next
- Back
- Back
- Next
- Next
- Back
- Back
- Next
- Next
- Back
- Back
- Next
- Next
- Back
- Back
- Zukiswa's story
- Asithandile's story
- Explore map


